
Modifications of the model
How n influences the model:
-
n=0: exponential growth — no suppression at all
-
n=1: standard logistic growth
-
n>1: sharper transition to saturation — growth slows down rapidly as tumor nears capacity

Acknowledging the Effects of the Tumor's Environment
Population growth over time
-
c(t) represents the size of a tumor or population (scaled by carrying capacity K)
-
The curve shows how quickly the tumor grows, how it slows down, and whether it stabilizes (plateaus)
-
Different values of n affect how early or late the slowing happens:
-
Small n → slower tapering off, smoother curve
-
Large n → growth appears fast at first, then suddenly levels off
-
Per Capita Growth Rate f(c) Over Time
-
This shows how fast each tumor cell (or individual) contributes to overall growth
-
This rate decreases over time as the tumor gets larger (due to space/nutrient limitations)
-
The shape of the drop depends on n:
-
Higher n causes the growth rate to drop more abruptly (stronger inhibition as tumor grows)
-
Lower n means the decline is more gradual (weaker suppression)
-
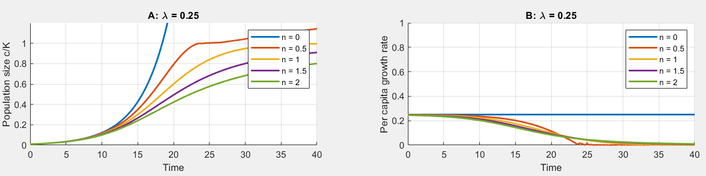
Figure 1: This represents the effect of different values of n on tumor growth when lambda(tumor growth rate)=0.25
Introduction of the Immune Killing Term
In a tumor growth model immune attack is represented by adding a killing term.It gives a more realistic and accurate depiction of tumor cells in the body.This is because as the tumor cells grow,the immune cells especially the cytotoxic T cells recognize them and actively kill them slowing down the growth of the tumor
-
γ= killing rate by immune cells
-
I = concentration of immune cells
-
c=Tumor cell population

Figure 2: This represents the effect of the immune killing term on different values of lambda (tumor growth rate)