
Model Replication
1. Logistic Growth Model Replication
The model initially varies tumor growth rate i.e. lambda. The higher the growth rate, the steeper the increase in tumor population size. As the tumor population approaches the carrying capacity, per capita growth rate approaches zero. The figure below is our replication of the model.
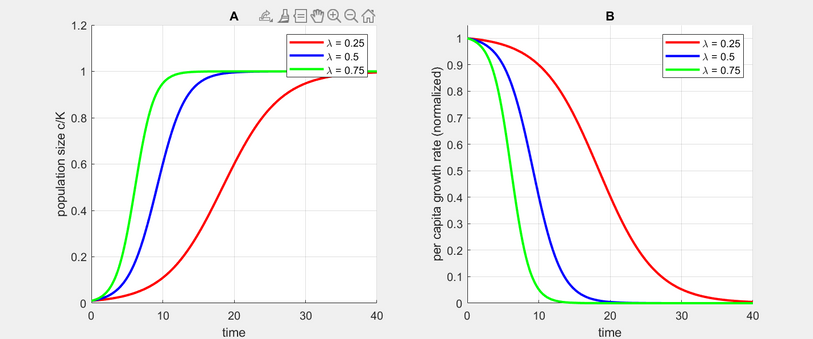
Figure 2a and 2b: Replication of Logistic Growth Model

Figure 2a and 2b: Graph of Logistic Growth Model (from the paper, page 7)
2. Gompertz Model Replication
The figure below is our replication of the Gompertz Model. The Gompertz Model is well known and widely accepted for describing the growth of biological processes, including tumor cells. Tumor growth rate is also being varied. However, the curves are less sigmoidal.

Figure 3a and 3b: Replication of Gompertz model
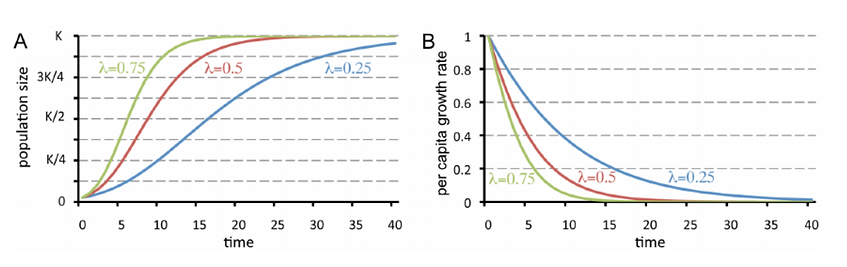
Figure 3a and 3b: Graph of Gompertz model (from the paper, page 8)
3. Anti-Tumor Treatment Replication
This graph varies the strength of the cell kills after the tumor has grown for about 40 days. As the strength increases with the population size (c), we notice a significant reduction in the tumor size but with the carrying capacity (K), we notice a slower reduction in the tumor size.

Figure 4: Replication of Anti-Tumor Treatment with cell kill of different strengths, 40 days after tumor growth
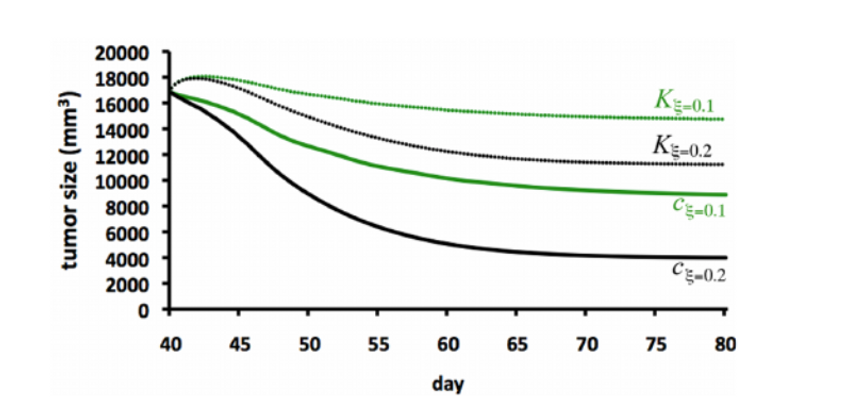
Figure 4: Graph of Anti-Tumor Treatment with cell kill of different strength, 40 days after tumor growth (from the paper, page 11)
NOTE : On Figure 4, the graph from the paper and our replicated graph are not identical. Factors that contributed to this are:
- Slight differences in the values of ϕc and φKc^2/3 used
- The use of different ODE solvers which handle stiffness and step sizes differently
These differences are expected and do not significantly affect the model.